A Look is a report in Data Exploration, which is based on a query created using fields and filters from a specific Explore. Depending on your permissions, you can save reports as Looks to the Personal, Group, or Shared sections, or add them to a dashboard.
- Creating a new Look
- Adding dimensions and measures
- Adding subtotals and totals
- Running your query
- Creating filters
- Creating a data visualization
- Editing table calculations
- Drilling down on data points
- Saving your query as a Look
Creating a new Look
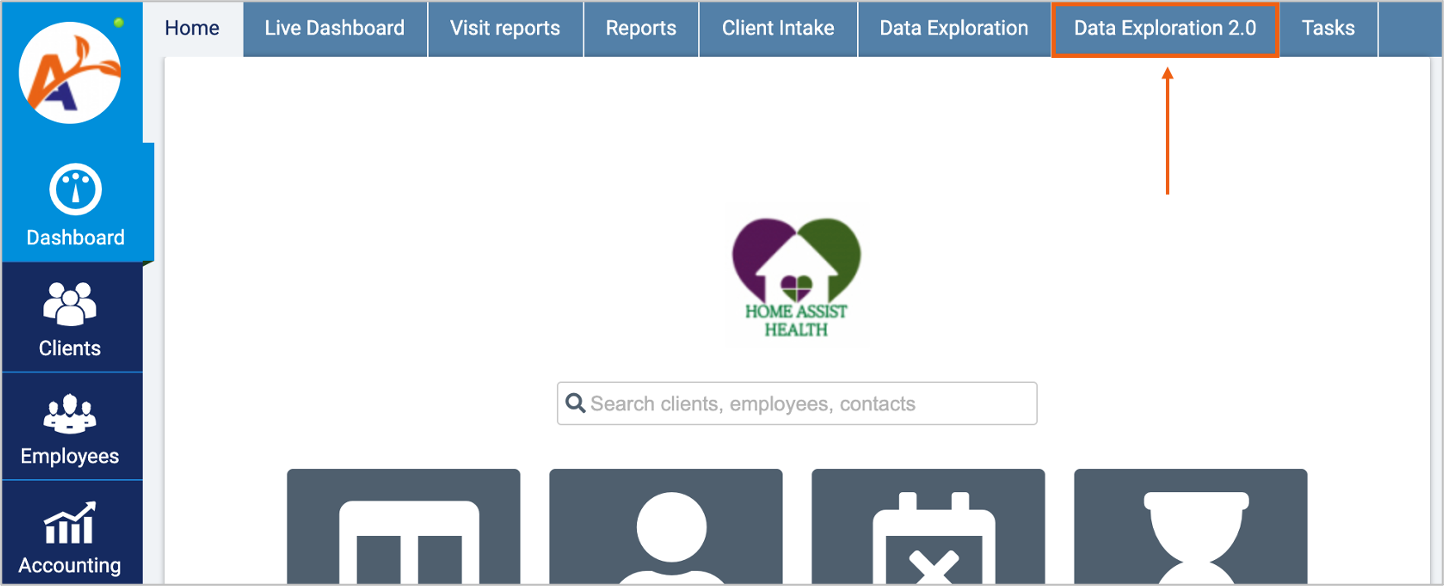
To access Data Exploration 2.0, select the Data Exploration 2.0 tab from a production or UAT environment.
To create a new Look, or to view Looks and dashboards that have already been created, choose an Explore.
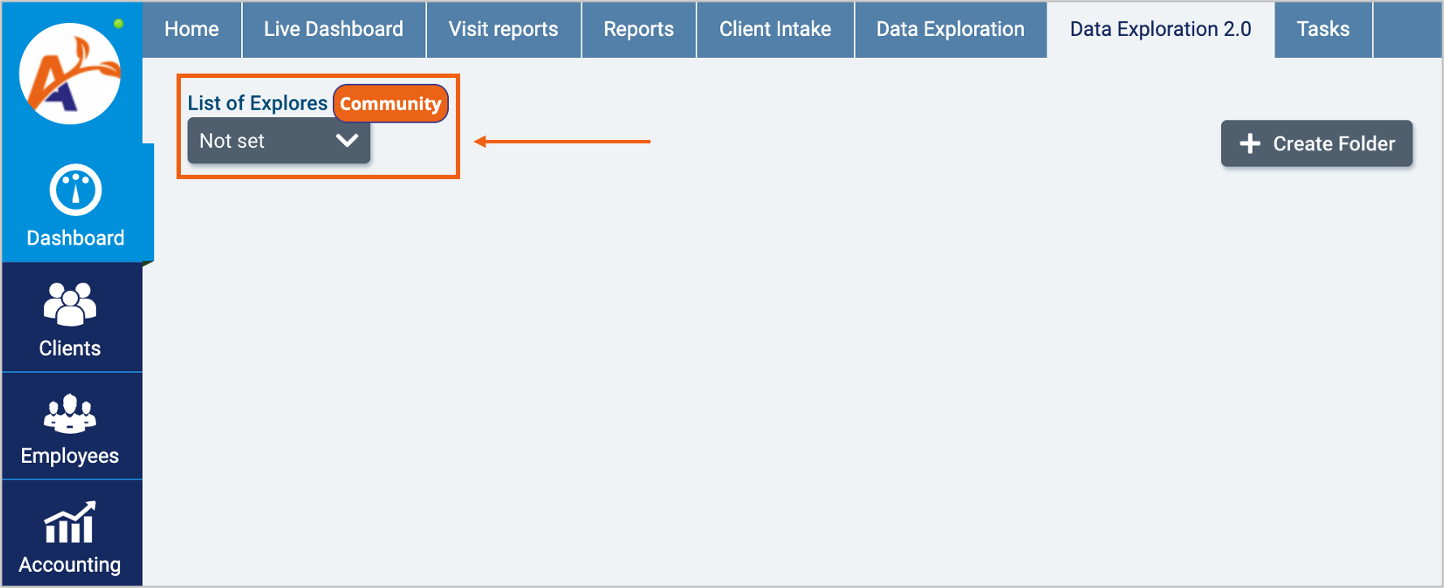
After selecting an Explore, you can begin to add dimensions and measures from the explore to create your query. You can also add dimensions and measures as filters.
Adding dimensions and measures
Use the search bar under the Explore name to search for the dimensions and measures you wish to add to the Look.
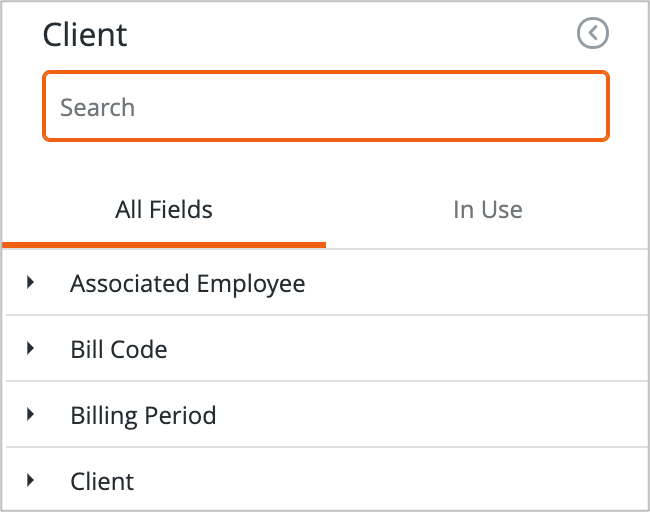
Click the field name to add the dimension or measure.
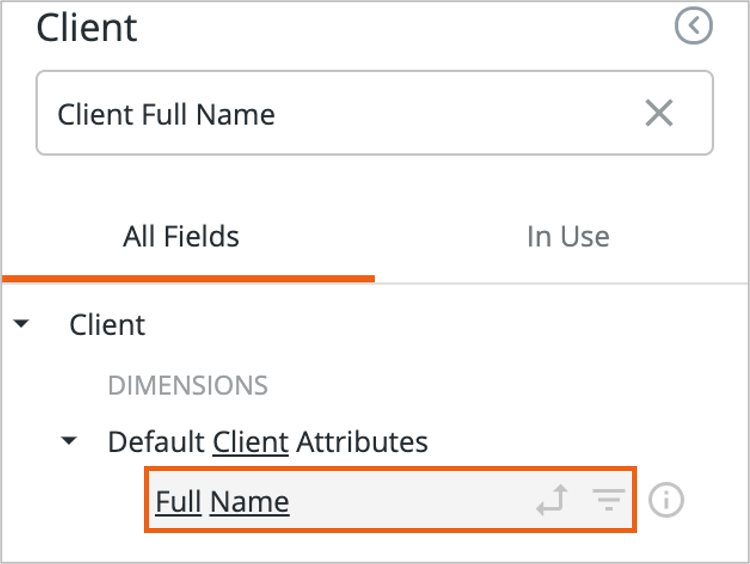
Alternatively, click to expand a section under All Fields to select dimensions and measures.
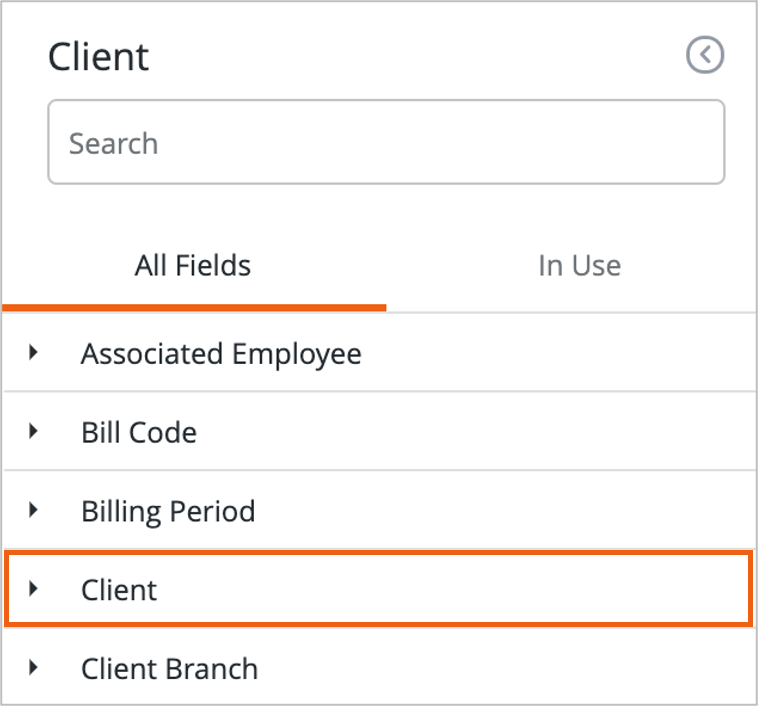
Click the field name to add the dimension or measure to your query.

Note measures will appear in orange.

Any form context fields that exist in the Explore will be available to select as dimensions.
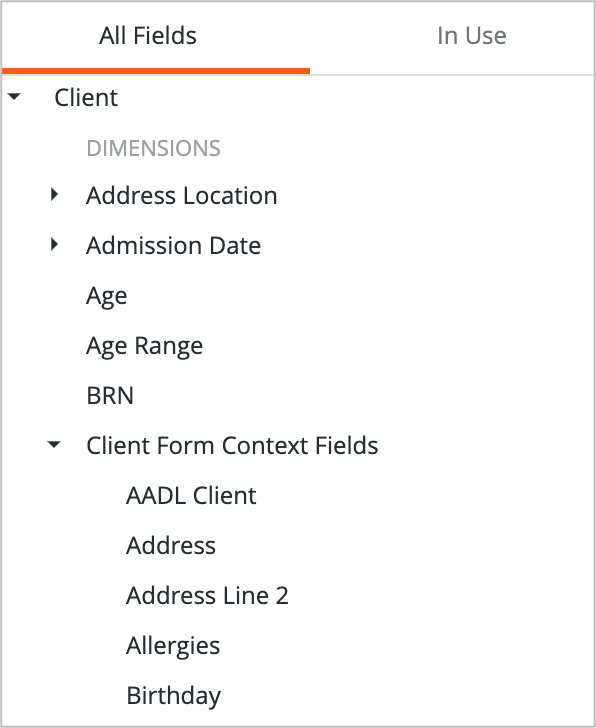
Additional information on form context fields
Form context fields will become available in Data Exploration 2.0 within 24 hours after they are created in Settings > Form Context. After form context fields are added to Data Exploration 2.0 as part of a Look, the data in these fields will be refreshed at the same rate (every 2 hours or less) as other fields.
Only users with permission to view the specific form context field in the AlayaCare application will be able to view the data in those form context fields within Data Exploration 2.0. Users who cannot view certain form context fields in the application will see the fields in the dimension list but will not be able to see any data pertaining to those fields.
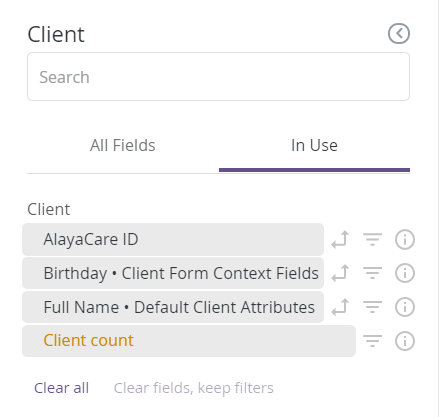
Fields that have already been added will be displayed under the In Use tab. Click the dimension/measure name to remove it or select Clear All to remove all fields.
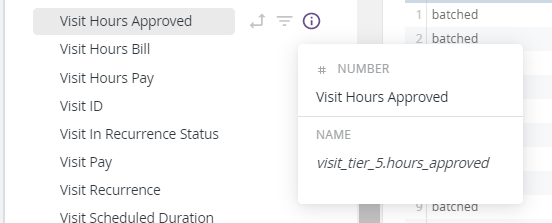
To view more information about a field (such as the field type), select the info icon.
When adding dimensions, you can pivot on a dimension by selecting the Pivot Data option. Each value in the dimension will become a column in your Look.
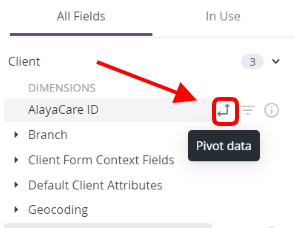
For example, when you pivot the client status dimension and select Run, each status will become its own column. See the example below where the Client Count measure was used in combination with the Client Status dimension to display the number of clients in each status:

You can also pivot or unpivot a dimension by selecting the gear icon for the field in the table.

Adding subtotals and totals
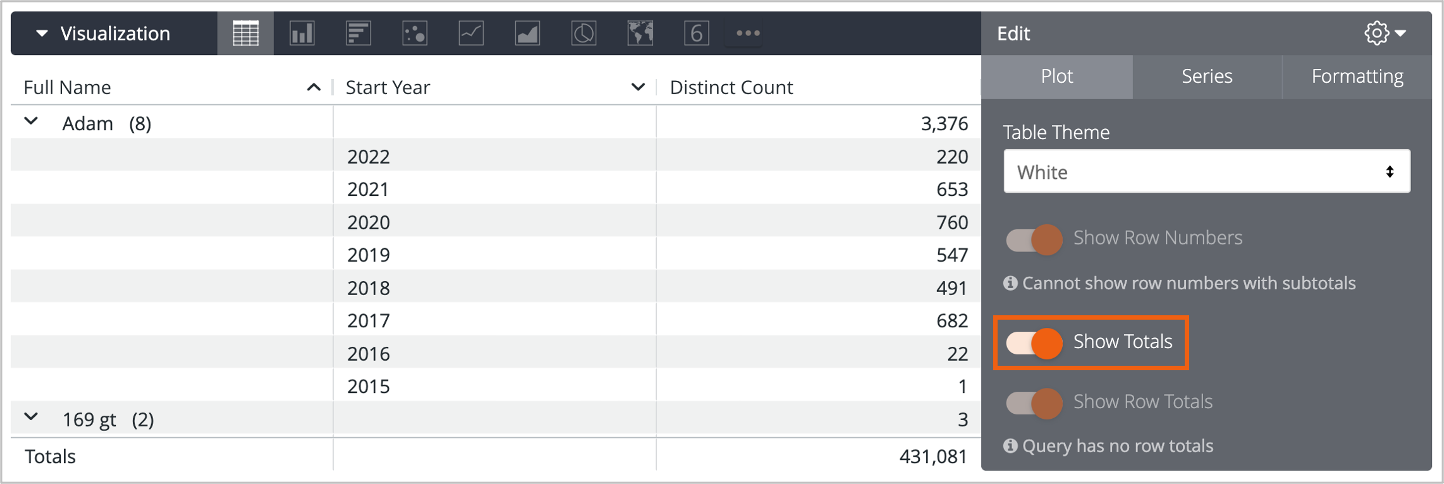
In the header for the data section, a checkbox is visible to enable totals. If two or more dimensions have been added to the report, a checkbox to enable subtotals in the report will also become visible. The checkboxes must be selected for them to appear in a visualization.

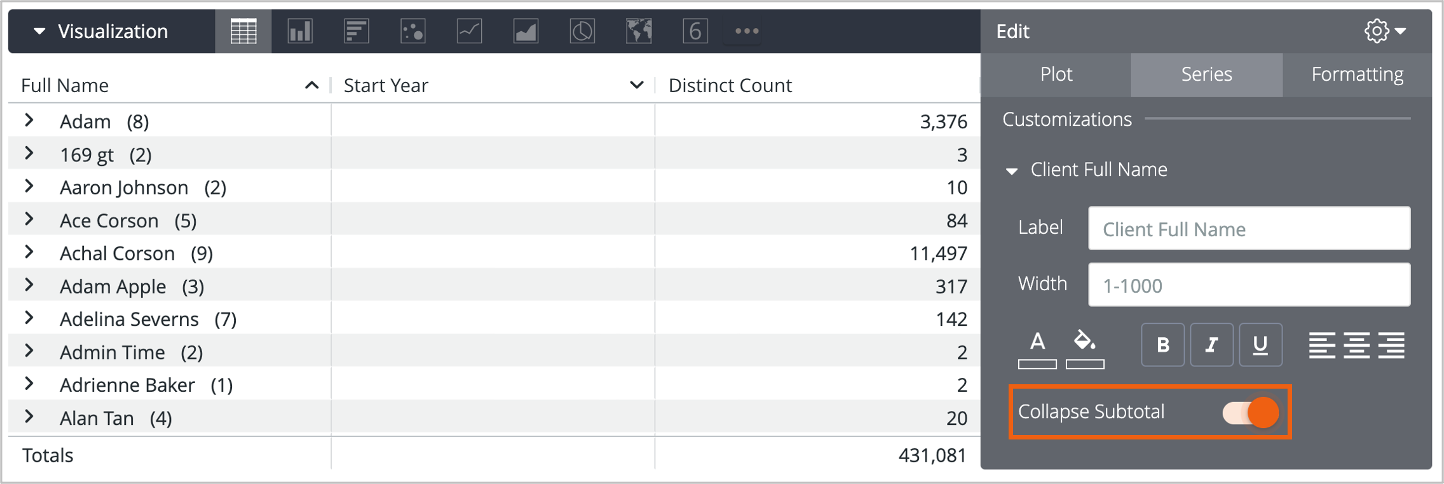
Once enabled, you can view subtotals and totals from the visualization section using the Table chart type (note the Table (Legacy) chart type will not display subtotals). Use the Plot menu in the visualization settings to display/hide the totals row, and the Series menu to default subtotals for a specific dimension to be collapsed or expanded.
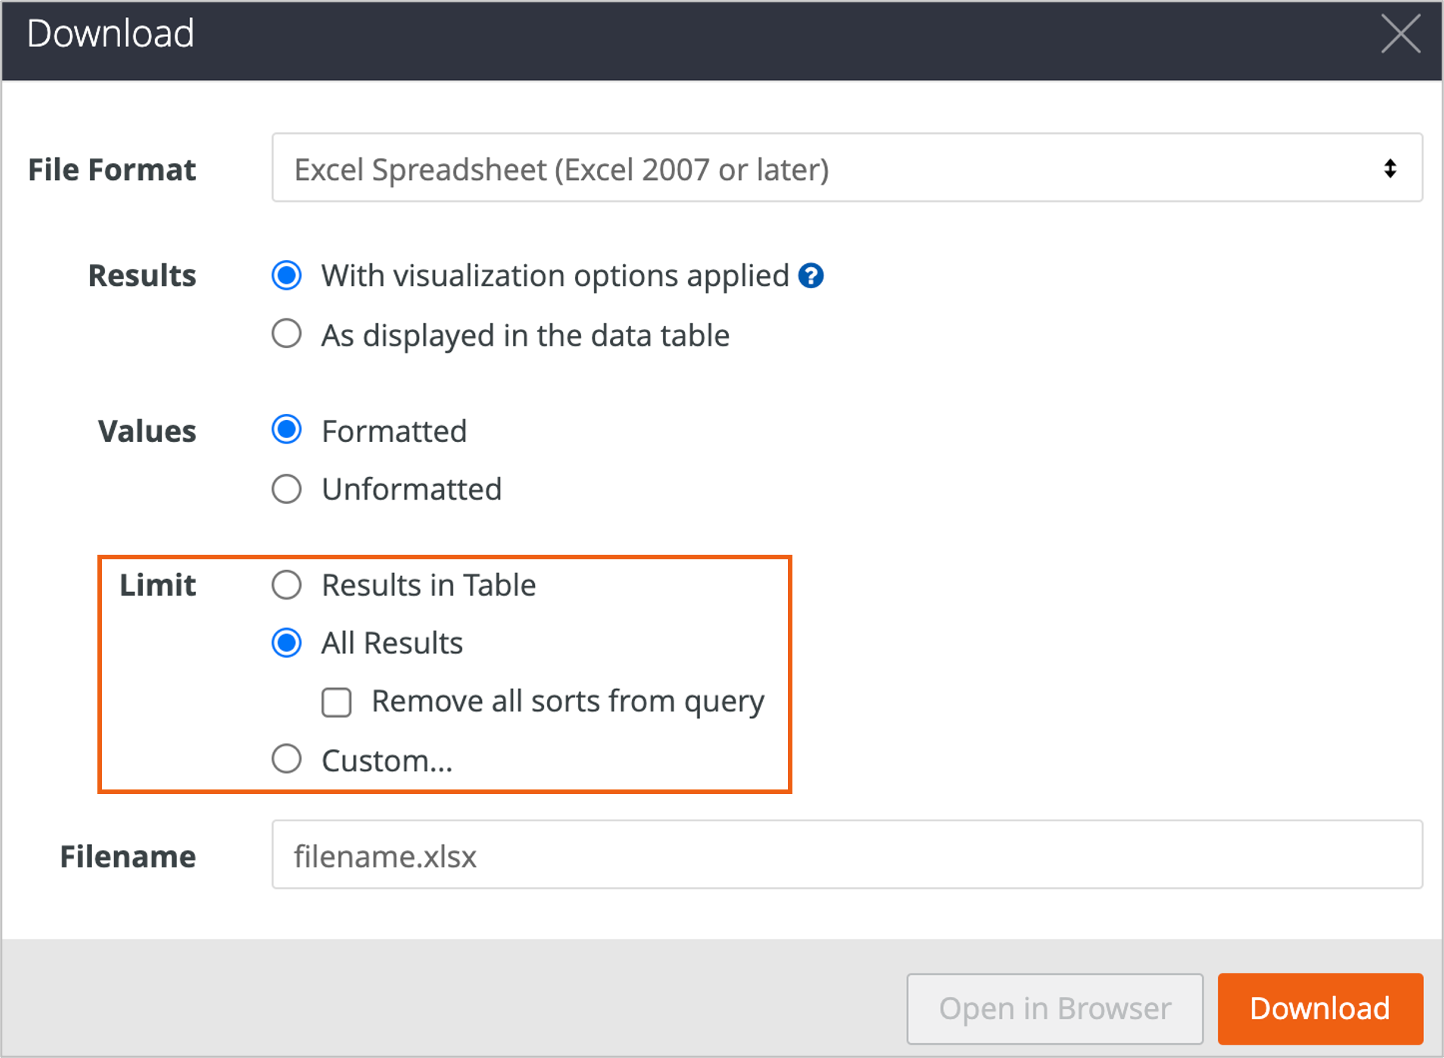
When downloading data, the Limit must be changed to All Results for subtotals to be exported
Running your query
Once you have added some dimensions and measures to define your query, select Run to populate the report with data.
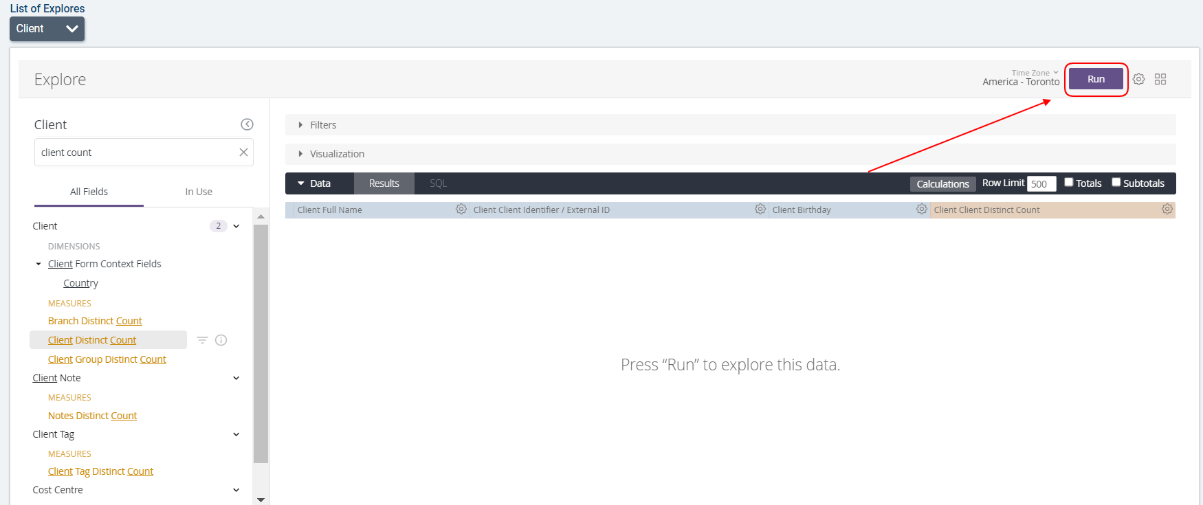
After clicking Run, the number of rows in the report and the last time that the data was run will be displayed next to the Run button.
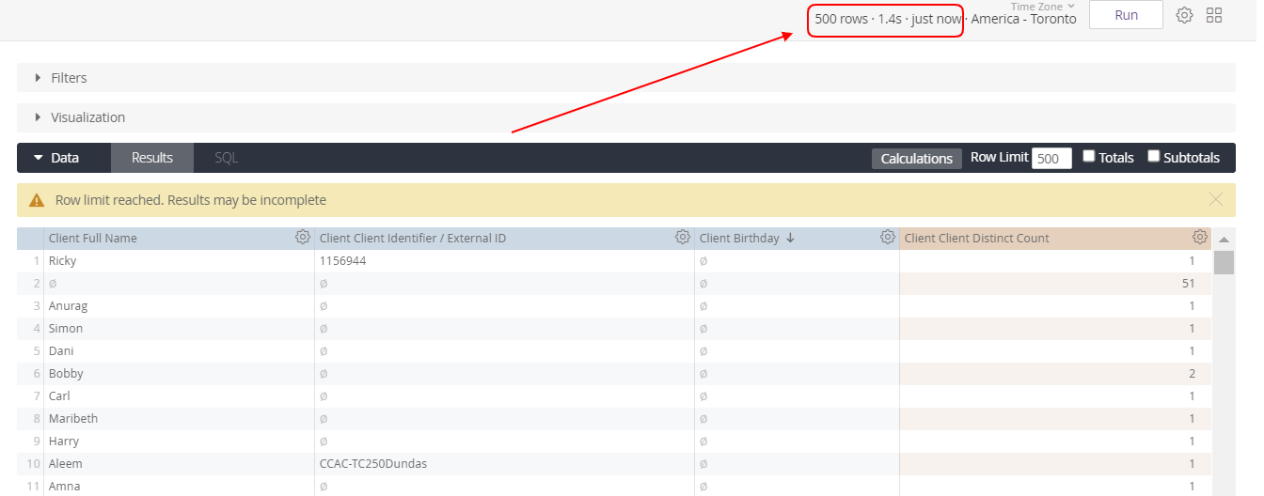
Note that for performance reasons, the number of rows that can be displayed at once in Data Exploration 2.0 is set to 500 rows. You can view all the results by downloading the query.
You must select Run when adding new dimensions or measures before you will see data in the new fields. The Run button will be purple if you have added new criteria to your query but have not yet updated the data by clicking Run.
To make building reports more efficient, you can use the following keyboard shortcuts to run your queries:
- Mac: Command-Return
- Windows: Ctrl+Enter
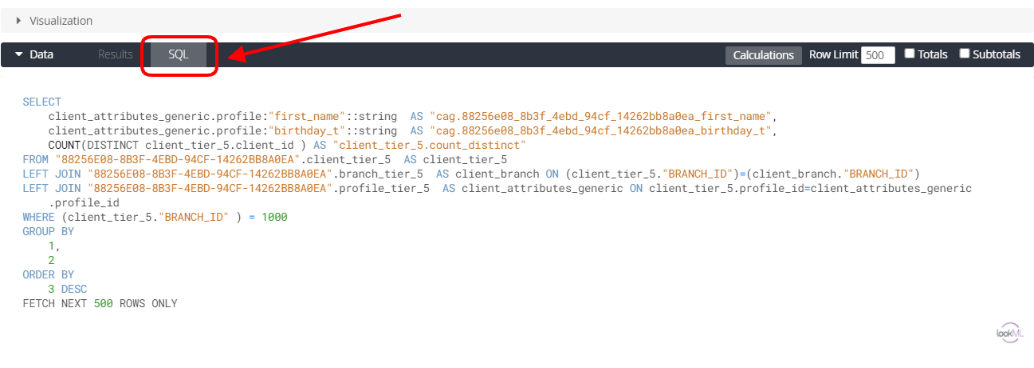
Depending on your permissions, you may also have access to the SQL tab on the table. You can navigate to this tab to view the SQL for the queries that you run. This permission also allows you to view details about any SQL errors that might occur when running queries.
Creating filters
When adding dimensions or measures, you can use the filter option if you wish to use the dimension to filter the query.
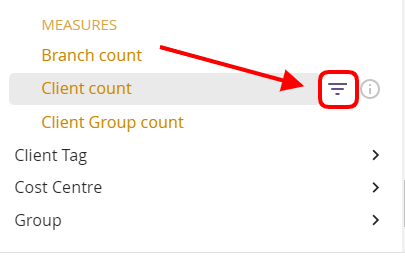
You can then set the criteria for the filter you added in the Filters section. Note that filter fields have auto-complete configured, so once you start typing, matching values will appear for you to select.

You can filter by measures as well as dimensions.

You can also filter by a dimension or measure by selecting the gear icon for the field in the table.
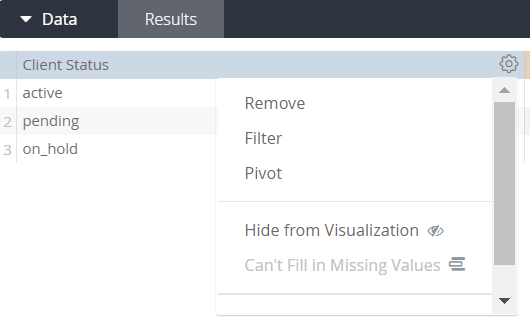
The types of filtering options available to select (is equal to, is blank, is greater than, is less than, is in range, etc.) will depend on the type of field you are filtering on (string, number, date, time, etc.).

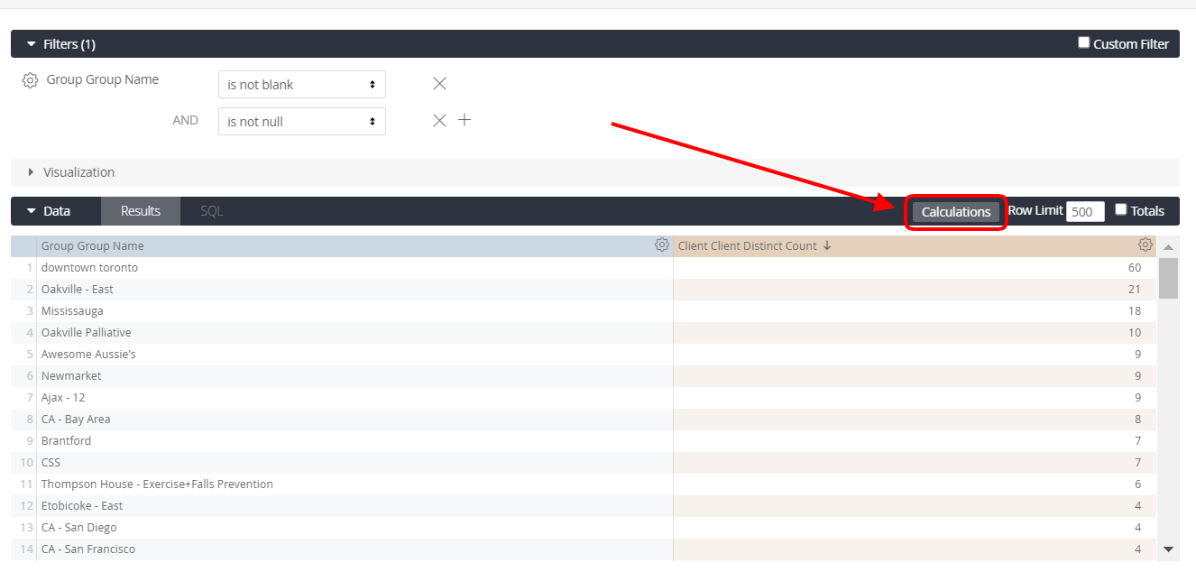
Click + to add a new condition to the filter. For example, the filter below would exclude values for the dimension you are filtering on that are either blank or null.

You also have the option to create custom filters by checking the custom filter box.

Custom filters are advanced Looker functionality. Once set up, the custom filters will remain in place on the Look so other users can see the data in the filtered view you have created. You can learn more about Looker expressions here.
You can also learn more about filtering options and filter best practices in Looker here.
Creating a data visualization
You can configure the visual display of the data in your Look from the Visualization tab. This configured visualization will be displayed when users open the Look or view it as part of a dashboard.
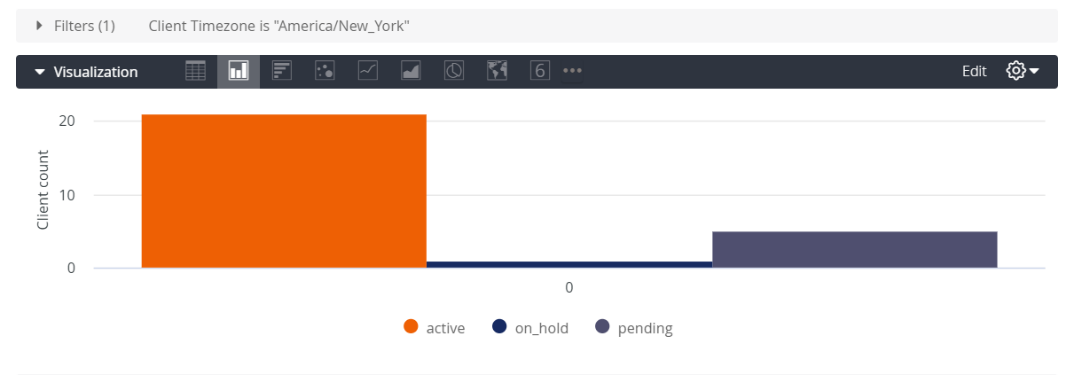
From here, you can choose among different chart types.

For example, if you wish to create a map by geocode of where your clients are located, after adding the client Location dimension you can use the Map Chart Type as the Visualization to see the distribution of clients by geographical location.

Select Edit to make changes to how the data is displayed through the visualization.

You can learn more about advanced Looker visualization options here.
Note that all text labels displayed for a Look must be edited from the Visualization tab, including the headers in the data table. For example, if you wish to edit the headers that are displayed when data is exported as a table, you will need to change the field names by going to Edit>Series>Labels and customizing the labels.
Editing Table Calculations
Custom table calculations allow you to use operations (similar to the formulas available in spreadsheet tools like Excel) to perform specific calculations on the results of your query. You can perform all sorts of mathematical, text-based, and date-based calculations on the dimensions, measures, and other table calculations in your query.
To create a custom table calculation for your query, select Calculations.
In the Edit Table Calculations dialogue, you can enter a Name for your custom calculation and then start typing to define the formula you wish to use to calculate a custom output from the results of your query.
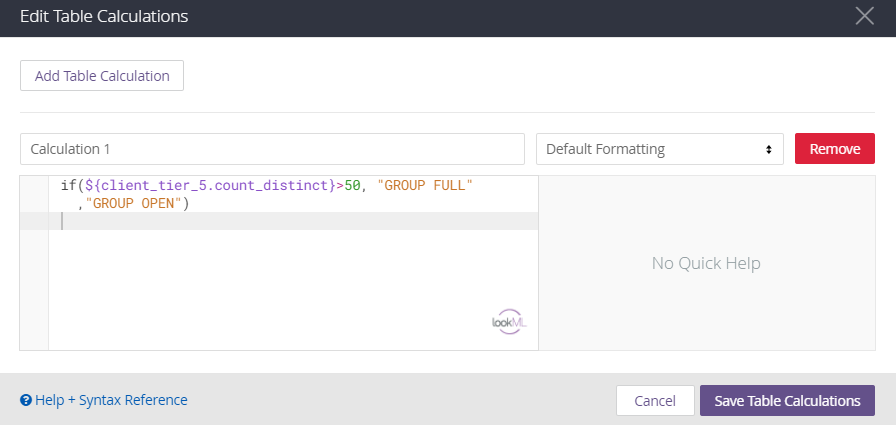
To add a second custom table calculation, select Add Table Calculation.

Clicking Save Table Calculations will add your calculation to the table as a new column. Table calculation columns will appear in green rather than orange (like measures) or blue (like dimensions).
You can learn more about using Looker table calculations here. For more about creating Looker expressions for calculations, check out this page.
Drilling Down on Data Points
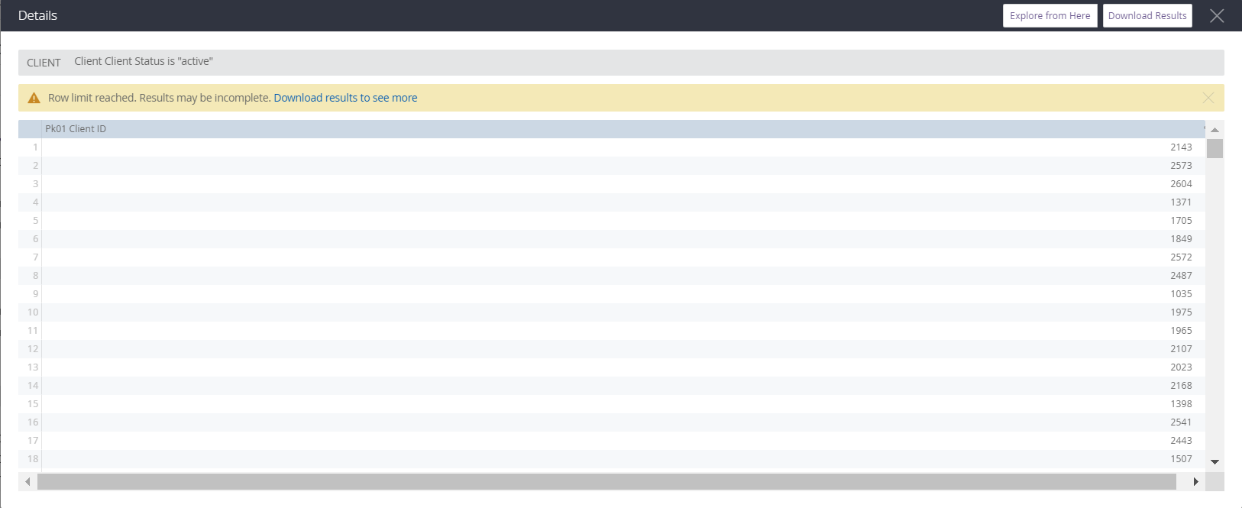
Once you have run your query, you can choose to drill down on a single data point to learn more about your results.
To begin, click on the result you wish to explore further.

A new window will open with more information about the specific result.
From here, you can click Explore from Here to launch a new query based on these results that you can save as a Look or select Download Results to download the drill-down results.
Saving Your Query as a Look
To save your query as a Look, go to the gear icon next to the Run button and select Save as a Look.

Enter a Title for the Look and an optional Description. Depending on your permissions, you may be able to choose to save the Look to either your personal folder or the agency-wide group folder by clicking Personal or Group on the right side.

Finally, select either Save to return to the previous screen or Save and View Look if you wish to open the Look directly. For more information about viewing and exploring Looks, navigate to the next section of the user guide.
To save your query to a dashboard, select Save to Dashboard.
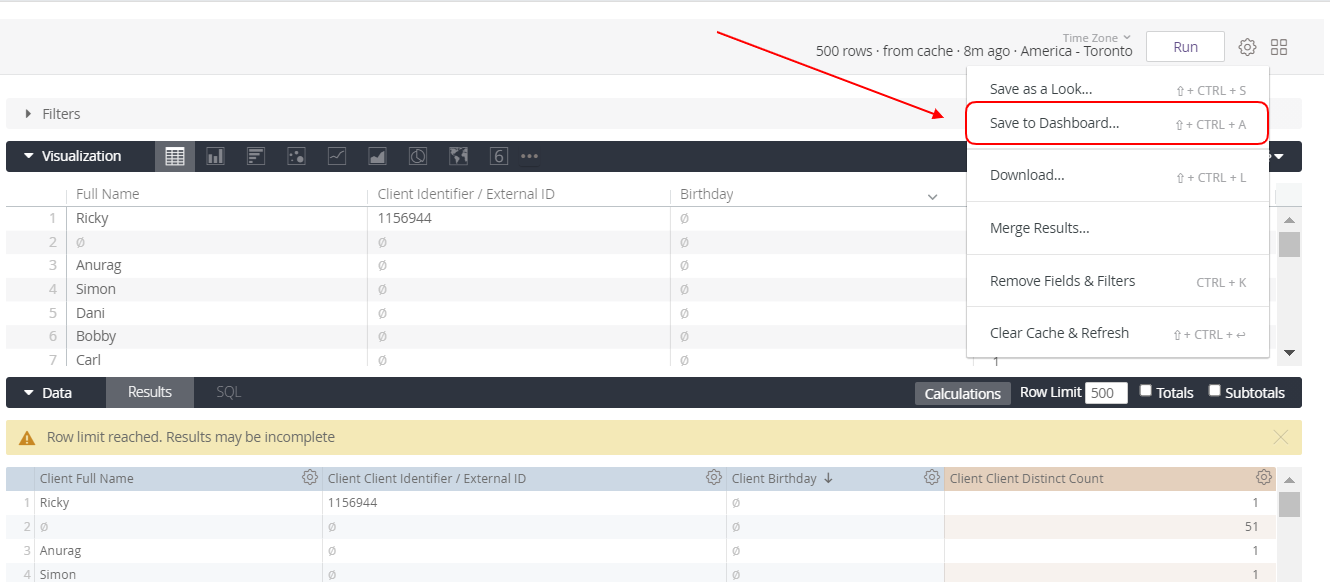
Enter a title for the Look and select the name of the dashboard you wish to save it to. Depending on your permissions, you may be able to choose to save the Look to either your personal folder or the group folder or the agency-wide group folder by clicking Personal, Group or Shared on the right side.
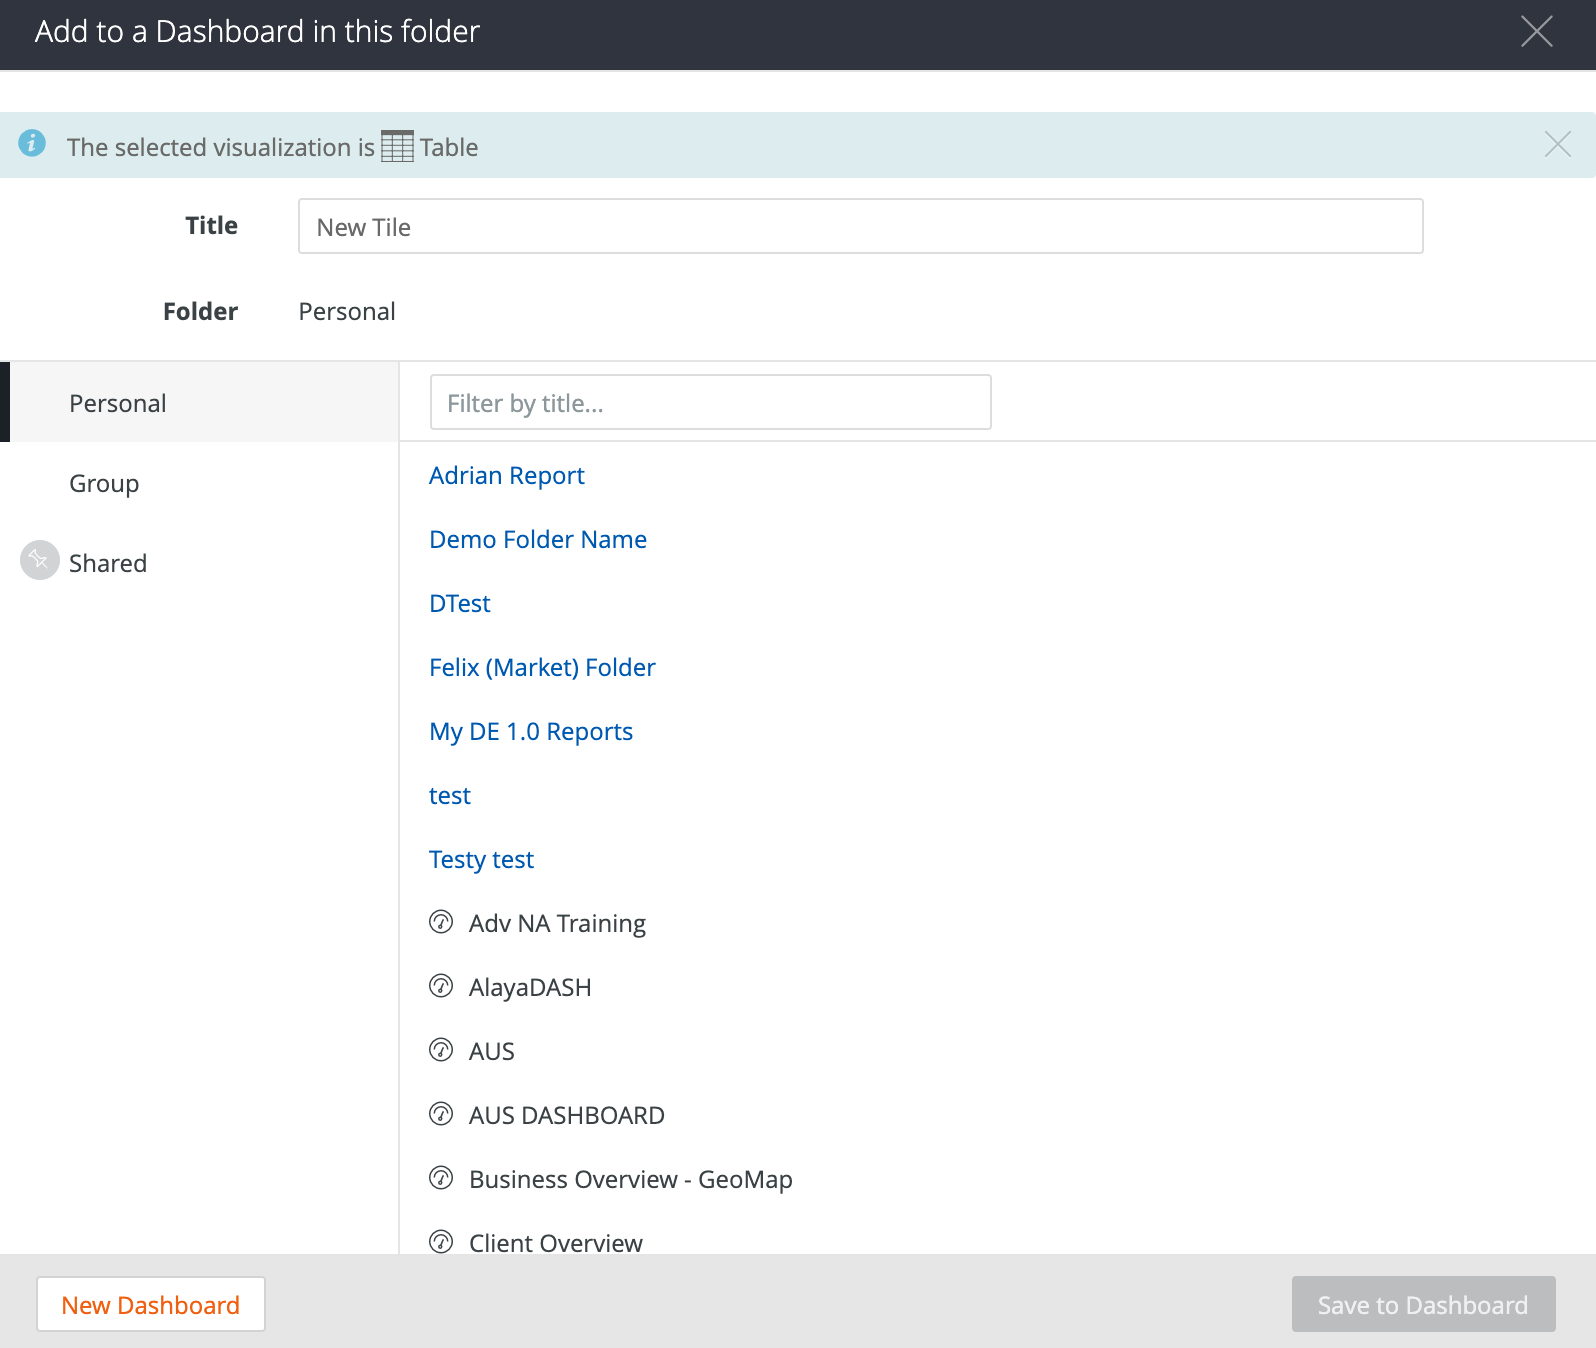
When you are ready, select Save to Dashboard.
To save the Look to a new dashboard, select New Dashboard. You will be prompted to enter a name for the dashboard you wish to create so you can save the Look to this new dashboard.
Clearing the cache and refreshing results
When creating a query in an Explore or viewing a saved Look, you can select the option Clear Cache & Refresh from the gear menu to ensure that you are viewing the most recent data available.
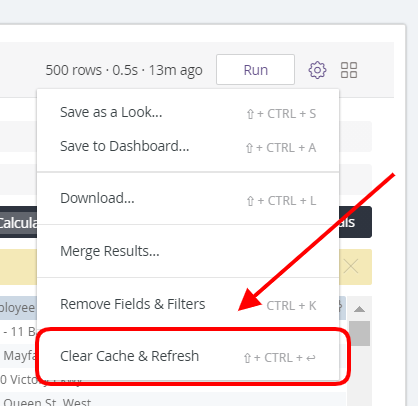
You can also use the following Looker keyboard shortcut to clear the cache and refresh results when viewing a Look or dashboard or when creating a new query:
- Mac: Command-Shift-Return
- Windows: Ctrl+Shift+Enter
If you are creating a new query, this action will clear your cache and run the query to return new results. If you are viewing a Look or dashboard, this action will clear your cache and refresh the data shown in the Look/dashboard.
You can learn more about Looker keyboard shortcuts here.
Comments
0 comments
Article is closed for comments.