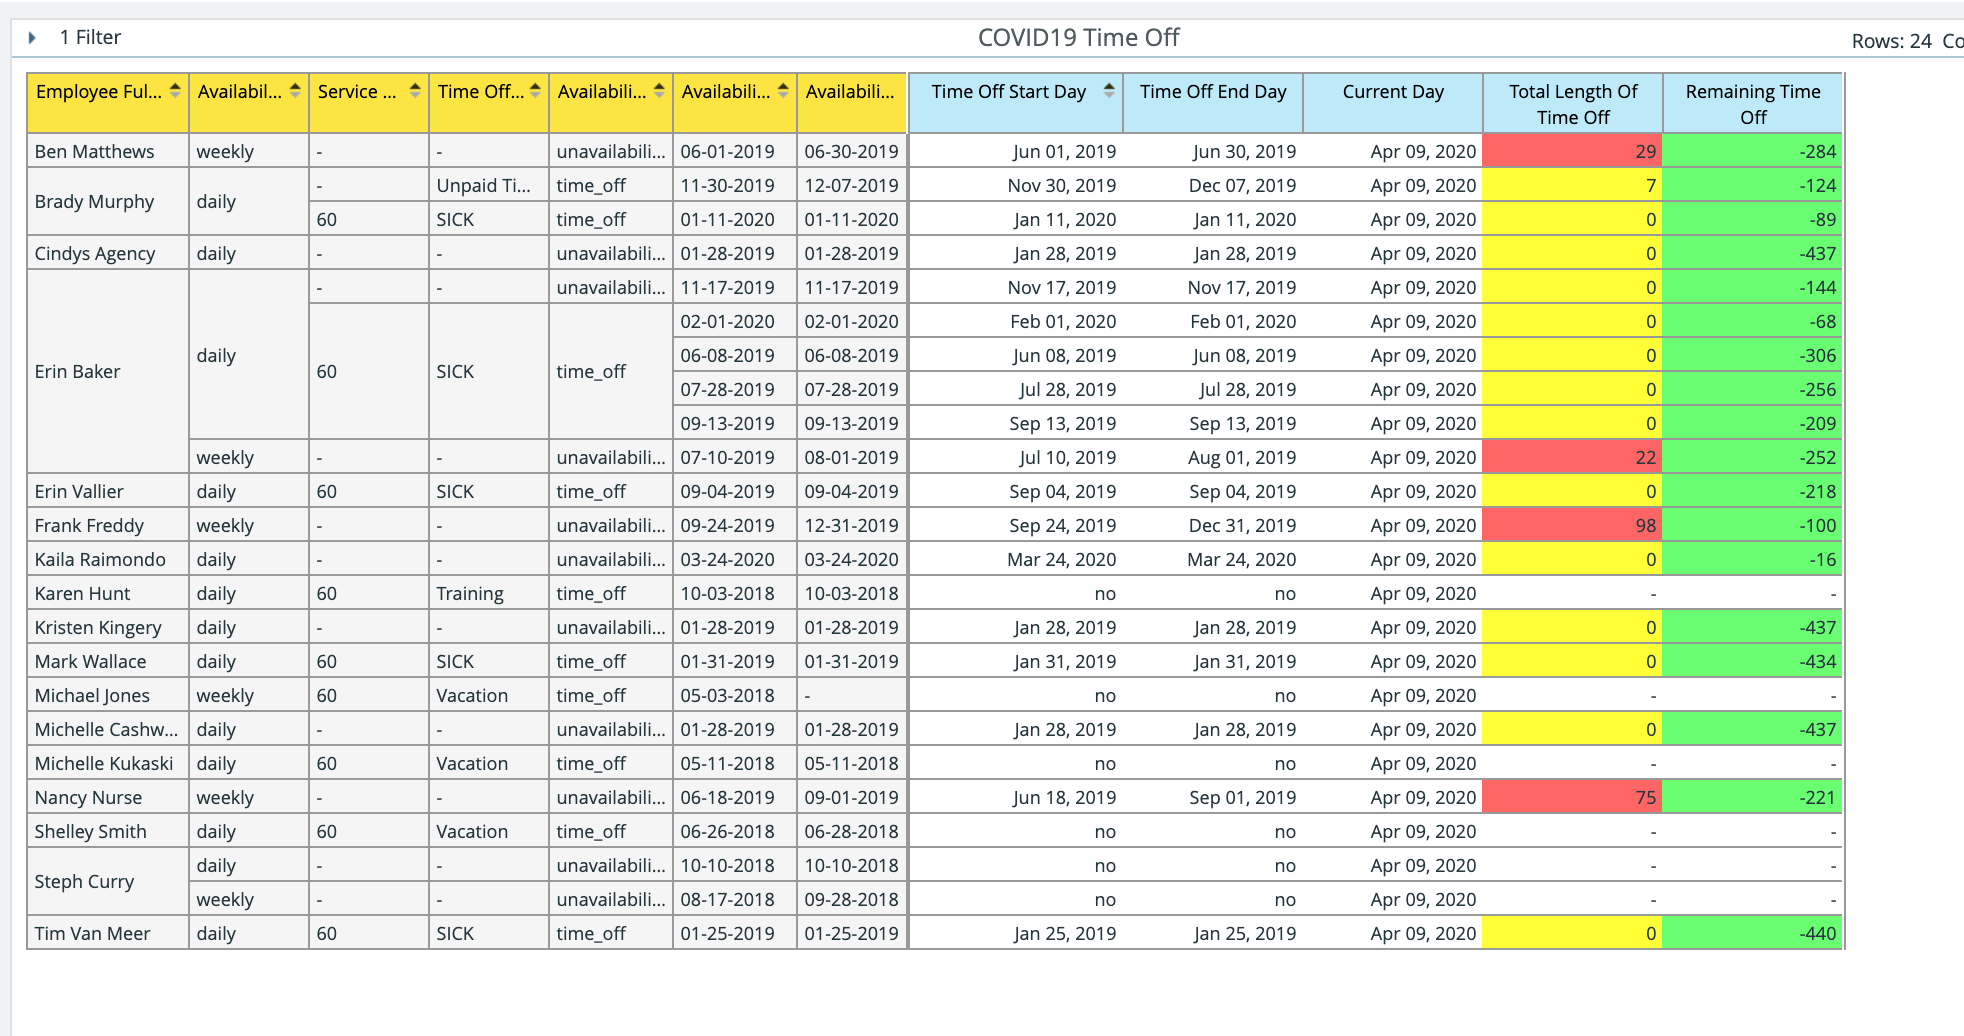
Building a COVID-19 time off report will help your organization facilitate the process of screening employees as they return to work following a possible or confirmed case of the coronavirus. You should build this report in the availability cube after creating a special COVID-19 time off type to keep track of employees that have days off remaining with that time off type.
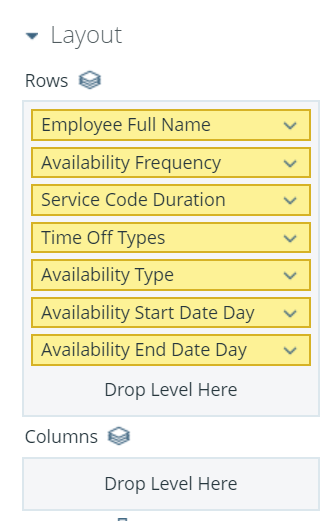
For this report, select Availability as the Report Type and add the following rows: Employee Full Name, Availability Frequency, Service Code Duration, Time Off Types, Availability Type, Availability Start Date Day, and Availability End Date Day.
To create the required measures for this report, you will need to define the names and formulas yourself using the information provided below.
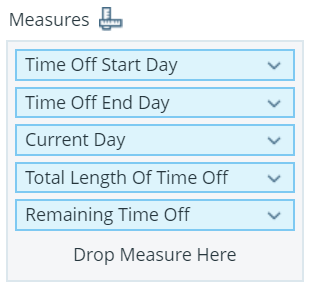
To begin, add any measure from the list to your report. The right click on the measure and select User Defined Measure>Create Calculated Measure.
In the dialogue, enter the name you wish to use as the Display Name for the measure (Time Off Start Day, Time Off End Day, Current Day, Total Length of Time Off, Remaining Time Off). Next, use the text box to enter the conditions you wish to use for calculating the level of risk. For this step, simply copy and paste the entire block of logic for each measure from the User Defined Measures for COVID-19 Time Off Report document. Complete this step for each of the five user-defined measures you need to create.
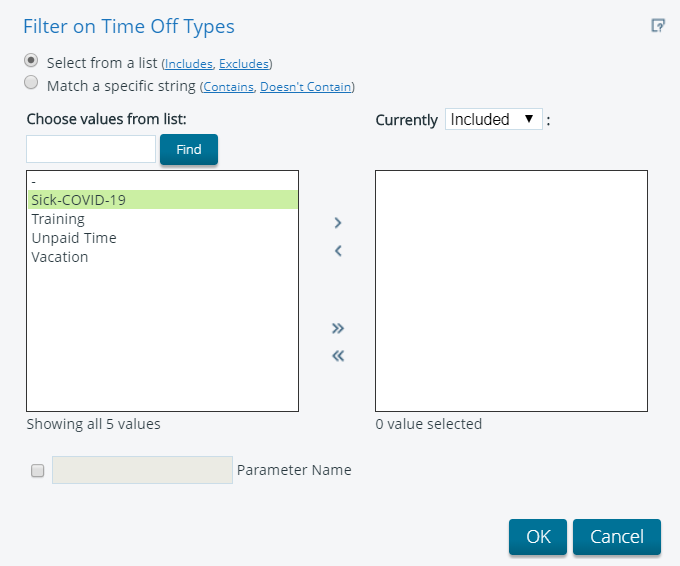
Once you selected your rows and user-defined measures, add Time Off Types as a filter and select the special time off type you created for COVID-19.
Finally, make sure to save your report.
Running the COVID-19 time off report will allow you to see which caregivers with that time off type are nearing the end of the number of days they are required to take off before coming back to work. Once you have built this report, you can add a widget of type Data Exploration Graph to your dashboard so you can easily monitor the data. To learn more, see How do I configure my dashboard?
Comments
0 comments
Article is closed for comments.